Social Media Performance Metrics Explained
Learn what social media performance metrics matter, how to track them across platforms, avoid common pitfalls, and build actionable reports.

Only 30% of social media performance metrics actually show you how they’re calculated. That means most dashboards give you numbers without the math behind them. In this guide you’ll discover what each metric really means, how to pull reliable data from nine platforms, and how to turn raw numbers into clear decisions.
We’ll walk through the core metric families, flag the traps that hide false success, and hand you a reporting framework you can use tomorrow. By the end you’ll know which numbers to trust and how to compare them across Instagram, TikTok, YouTube, LinkedIn, Facebook, X, Pinterest, Bluesky and Threads.
Table of Contents
- What Are Social Media Performance Metrics?
- Key Metric Categories and Why They Matter
- How to Track Metrics Across 9 Platforms Efficiently
- Common Pitfalls and How to Avoid Misinterpretation
- Benchmarking and Reporting: A Practical Framework
- FAQ
- Conclusion
What Are Social Media Performance Metrics?
Social media performance metrics are data points that tell you how your content, ads and conversations are doing on each network. They turn likes, clicks and views into business insight. As Wikipedia explains, social media platforms let users create, share and interact with content. When you measure that activity you get a picture of reach, engagement and impact.
Metrics fall into three groups: awareness, interaction and conversion. Awareness numbers , like impressions and reach , tell you how many eyes saw your post. Interaction numbers , such as likes, comments, shares and click‑through rate (CTR) , show how people responded. Conversion metrics , like leads, sign‑ups or sales , link social activity to revenue.
Why does this matter? Without clear metrics you can’t prove ROI to a boss or a client. You end up guessing which posts helped a campaign and which didn’t. A solid metric set lets you allocate budget, refine creative and set realistic goals.
Key Takeaway: Metrics turn raw social activity into actionable business insight.
Most tools hide the calculation method. When you see a CTR of 2% you should know it’s clicks ÷ impressions. If the formula isn’t shown, the number may be misleading. That’s why we recommend a dashboard that shows the exact definition for every metric you track.
SocialLead’s unified dashboard pulls data from all nine platforms and shows the same formula across each, so you avoid hidden math.
Bottom line: Understanding what each metric measures and how it’s calculated is the first step to trustworthy analysis.
Key Metric Categories and Why They Matter
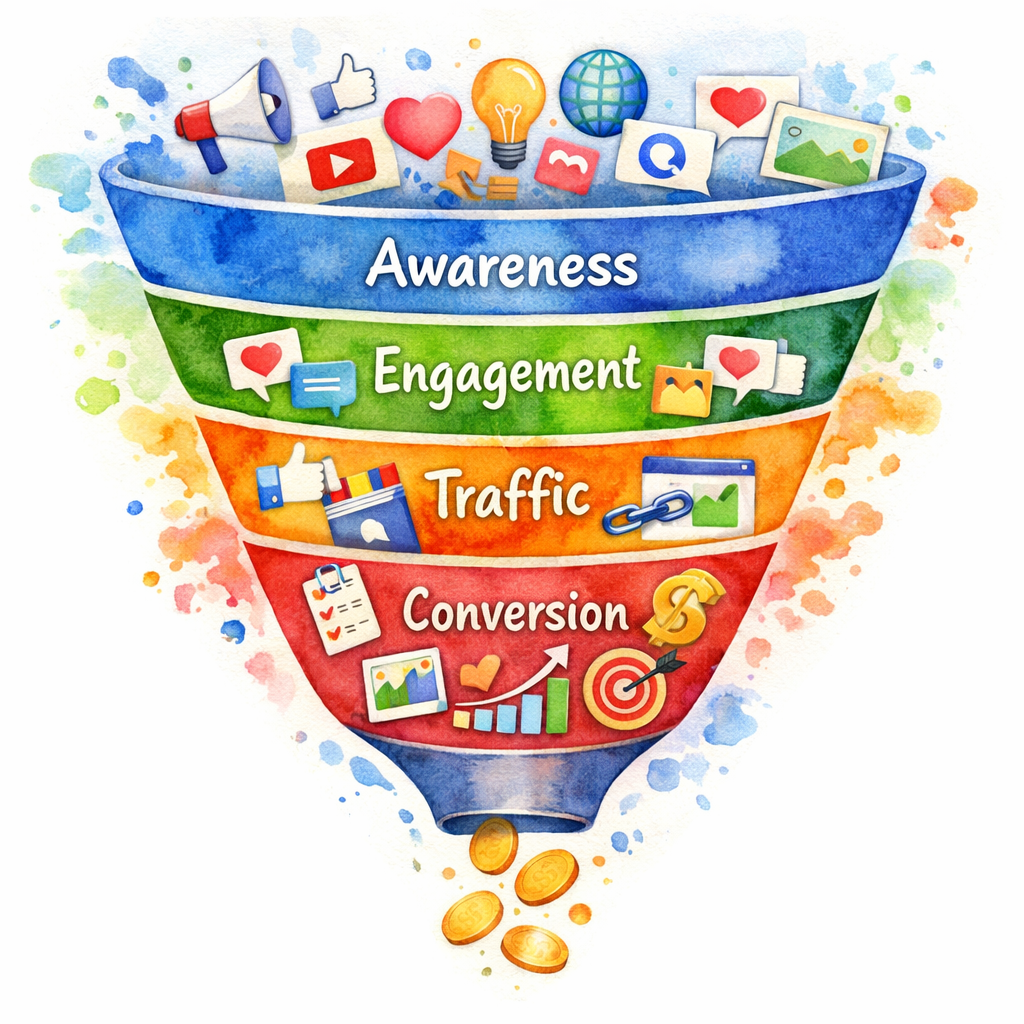
Metrics group into four categories that match the marketing funnel: awareness, engagement, traffic and conversion. Each category answers a specific question about your audience.
Awareness tells you if people are seeing your brand. Reach counts unique users; impressions count total views. High reach with low impressions suggests you’re hitting many new eyes without repeat exposure.
Engagement measures how users interact. Engagement rate is (likes + comments + shares) ÷ total impressions. It normalizes raw numbers so you can compare a 10‑post week to a 2‑post week.
Traffic looks at clicks that leave the platform. Click‑through rate (CTR) is clicks ÷ impressions. A high CTR means your call‑to‑action (CTA) is compelling.
Conversion ties social activity to business outcomes. Conversion rate is conversions ÷ clicks. This is the metric most CEOs ask for because it links directly to revenue.
Pro Tip: Track the same metric across all platforms using a unified definition. That way a 3% engagement rate on Instagram means the same as a 3% rate on TikTok.
Imagine you run a product launch across Instagram and TikTok. Instagram shows 5,000 impressions, 150 likes, 30 comments. TikTok shows 8,000 impressions, 200 likes, 40 comments. Using the same engagement formula you see Instagram’s rate is (150+30) / 5,000 = 3.6% and TikTok’s is (200+40) / 8,000 = 3.0%. You now know Instagram is slightly more effective for that content type.
When you compare numbers without a shared definition you risk chasing vanity. A platform might label “engagement” differently , some include saves, others don’t. That’s why a unified dashboard matters.
SocialLead supports bulk video upload, AI‑powered captions and a single view of all nine platforms, so you can see the same metric side‑by‑side.
Bottom line: Group metrics by funnel stage, use a consistent formula, and compare apples‑to‑apples across platforms.
How to Track Metrics Across 9 Platforms Efficiently
Collecting data from nine networks can feel like juggling. The trick is to let an API do the heavy lifting while you focus on insight.
Most platforms expose a REST API that returns JSON. You can pull posts, impressions, clicks and more with a few calls. The official Stream blog breaks down rate limits and auth steps for each major network. Knowing those limits helps you avoid throttling.
Step one: set up OAuth for each account. You only need to do it once per platform. Once you have a token you can request the metrics you need.
Step two: schedule a daily pull. Pulling every 24 hours gives you a fresh snapshot without overwhelming the API. Store the JSON in a data lake or spreadsheet.
Step three: normalize the fields. Each API uses its own naming , “reach” might be “unique_audience” on one platform. Map them to a common schema: {date, platform, metric, value}.
1,000posts can be uploaded in a day with bulk tools
Bulk upload solves the time sink. As Bundle Social explains, uploading 200 videos manually would take 50 hours. One API call per video cuts that to minutes.
When you combine the API pulls with SocialLead’s unified dashboard, you get a single table that shows, for example, Instagram video views, TikTok likes and YouTube watch time side by side. The dashboard also flags any missing data so you can re‑run the pull.
Here’s a quick workflow you can copy:
- Connect each platform in SocialLead’s settings page.
- Set a nightly cron job that calls the platform APIs.
- Map the raw JSON to the dashboard’s metric schema.
- Review the daily report and spot spikes or drops.
Because the dashboard updates in real time, you can catch a sudden dip in engagement before a campaign loses momentum.
SocialLead’s AI‑powered scheduler, described in our free social media scheduler guide, even suggests the best time to post based on past performance, so you can close the loop between publishing and measurement.
Bottom line: Use platform APIs with a nightly pull, normalize data, and view everything in one dashboard to save time and avoid gaps.
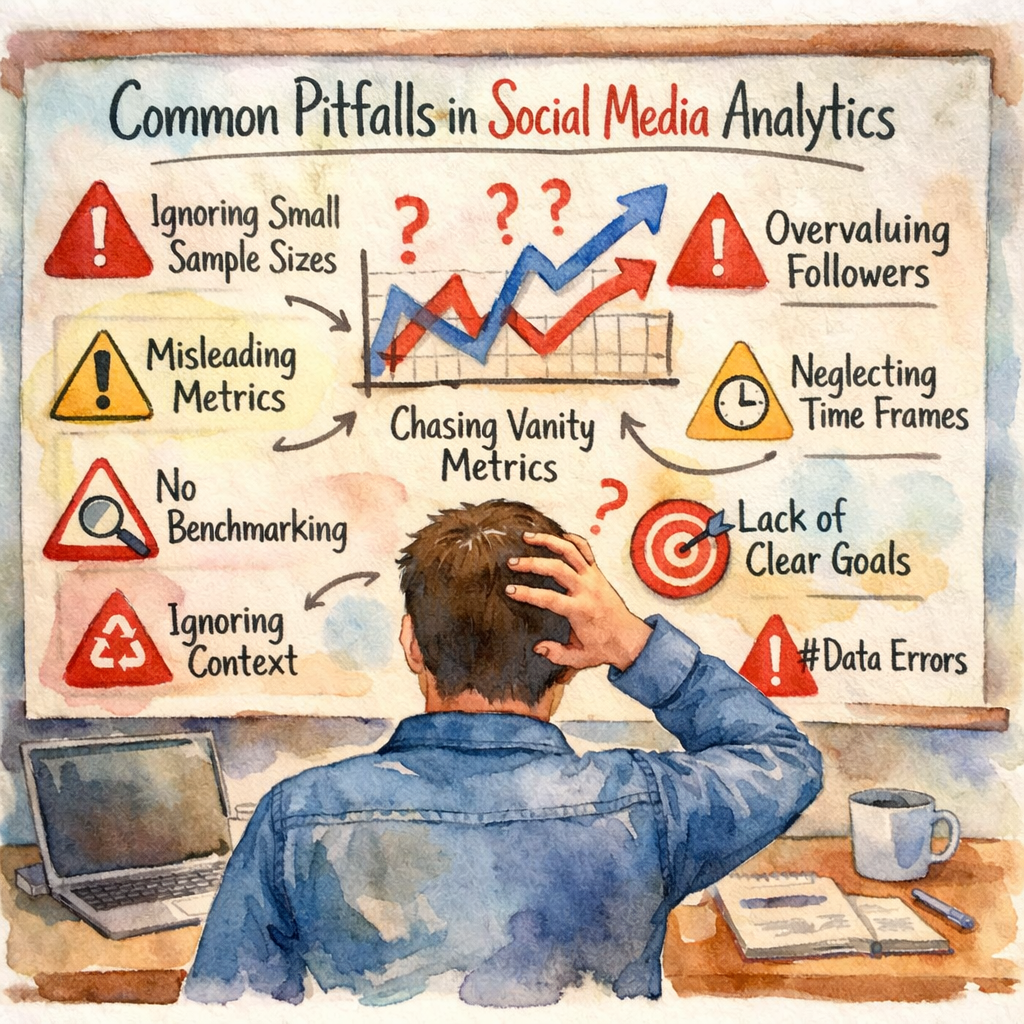
Common Pitfalls and How to Avoid Misinterpretation
Even with perfect data you can still draw the wrong conclusions. The biggest mistakes involve focusing on the wrong numbers or ignoring context.
First, vanity metrics like raw likes or follower count look good but rarely predict sales. A post with 1,000 likes but a 0.1% CTR isn’t driving traffic. Shift focus to engagement rate and CTR, which show interaction depth.
Second, ignore seasonality. A dip in December may be normal for B2B brands. Compare week‑over‑week or month‑over‑month rather than raw day‑to‑day.
Third, treat every platform the same. Instagram rewards visual storytelling, X values rapid conversation. Track platform‑specific metrics , story views on Instagram, retweets on X , instead of a one‑size‑fits‑all approach.
"A high engagement number can still be negative if sentiment is bad."
Sentiment analysis adds nuance. A viral post may get many comments, but if most are negative the post hurts brand perception. Tools that score comments as positive, neutral or negative help you filter that out.
Fourth, rely on automated reports without a human review. Automation flags trends, but a marketer should verify spikes. Maybe a bot flooded comments, or a platform glitch inflated views.
Pro Tip: Set up alerts for metric thresholds. If CTR falls below 1% for two days, investigate the creative.
Finally, don’t forget data quality. A broken tracking pixel can drop all click data. Regularly audit your tags and API responses.
SocialLead’s dashboard includes a health check that scans for missing data and alerts you to gaps, so you catch issues early.
Bottom line: Avoid vanity, respect platform differences, add sentiment and audit data to keep insights trustworthy.
Benchmarking and Reporting: A Practical Framework
Metrics are only useful when you have a reference point. Benchmarks give you that context.
Industry reports show average engagement rates by sector. For example, the entertainment industry typically sees 1.75% engagement on Facebook, while financial services see around 2.12% (source: Hootsuite benchmarks). Knowing where you sit helps you set realistic goals.
Build a reporting framework with three steps:
- Collect your own baseline for the past 30 days.
- Compare it to the industry benchmark for each platform.
- Identify gaps and set a target improvement percentage.
Here’s a simple table you can copy into a spreadsheet.
| Platform | Your Engagement Rate | Industry Avg | Target |
|---|---|---|---|
| 3.2% | 4.5% | +0.5% | |
| 2.8% | 3.4% | +0.4% | |
| TikTok | 1.9% | 2.3% | +0.3% |
| 2.5% | 2.7% | +0.2% |
Update the table monthly. Highlight any metric that falls below the benchmark and add a note on what you’ll test , new creative, different posting time, or a revised CTA.
When you share reports with stakeholders, include a visual of the trend line and a short narrative. Explain why a dip happened (e.g., a holiday) and what you’ll do next.
Key Takeaway: Benchmarks turn raw numbers into performance goals.
SocialLead lets you export the dashboard as a PDF, add your own benchmark rows, and send the report with one click.
Bottom line: Use industry benchmarks, track your own baseline, and set incremental targets to keep improvement steady.
FAQ
What is the difference between reach and impressions?
Reach counts unique users who saw a post. Impressions count total times the post appeared, even if the same user saw it multiple times. Reach shows audience size, while impressions show how often you’re showing your message. Both matter, but reach is better for brand awareness and impressions help gauge frequency.
How often should I pull social media performance metrics?
A daily pull gives you fresh data without overloading APIs. For fast‑moving platforms like X, you may add an hourly check for high‑budget campaigns. Weekly pulls work for slower‑growing channels. Set the frequency based on your campaign speed and reporting cadence.
Which metric best predicts sales?
Conversion rate is the direct predictor because it links clicks to purchases. However, a strong engagement rate often precedes conversions, so track both. Look for a pattern: high engagement → higher CTR → higher conversion.
Can I compare metrics across different platforms?
Yes, but only if you use the same definition. Engagement rate is a good cross‑platform metric because it normalizes for audience size. Avoid comparing raw likes between Instagram and X, because the user behavior differs.
How do I handle missing data?
First, check the API response for errors. If a platform skipped a metric, verify the token and permissions. If the data is still missing, flag it in your report and note the gap. Consider using a backup tool or manual export for that period.
What tools can help with sentiment analysis?
Many AI platforms offer sentiment scoring on comments and mentions. Look for tools that tag each comment as positive, neutral or negative. Export the scores and add them to your dashboard to see how sentiment trends line up with engagement spikes.
Conclusion
Social media performance metrics are more than vanity numbers. They give you a roadmap from awareness to revenue when you define them clearly, track them across every platform, avoid common traps, and benchmark against industry standards. A unified dashboard eliminates hidden formulas and lets you compare apples‑to‑apples, so you spend less time hunting data and more time acting on it.
Ready to see all nine platforms in one view? on building a social media analytics dashboard for step‑by‑step setup tips. When you centralize data, you’ll spot trends faster, prove ROI, and keep your social strategy on track.
Start measuring, start improving, and watch your social ROI grow.


