Best social media analytics dashboard guide 2026
Social media analytics dashboard explained: learn the key metrics, data sources, and how to turn insights into growth for small businesses and creators.

Only 33% of the 21 dashboards actually deliver AI‑driven insights, and the tool that covers the most platforms (Buffer, 11 platforms) skips AI entirely , a stark surprise for anyone equating breadth with intelligence. In this guide you’ll learn what a social media analytics dashboard does, which metrics matter most, where the data comes from, and how to turn numbers into real growth.
Comparison of 13 Social Media Analytics Dashboards, April 2026 | Data from 9 sourcesName| Platforms Covered| Analytics Metrics| AI Insights| Best For| Source
---|---|---|---|---|---
SocialLead (Our Pick)| Instagram, TikTok, YouTube, LinkedIn, Facebook, Twitter/X, Pinterest, Bluesky, Threads| —| —| Best for newest platforms| sociallead.network
Agorapulse| Facebook, Google Business Profile, LinkedIn Pages, Instagram, Threads, X, TikTok, Pinterest, Bluesky, YouTube Channels, Meta, LinkedIn, TikTok| —| Yes| Best for enterprise‑grade coverage| zapier.com
Buffer| Bluesky, Facebook, Google Business, Instagram, LinkedIn, Mastodon, Pinterest, Threads, TikTok, X, YouTube| —| No| Best for platform breadth| buffer.com
Metricool| Facebook, Instagram, Threads, X, Bluesky, LinkedIn, Pinterest, Google Business Profile, TikTok, YouTube, Twitch| followers, posts, interactions, impressions, likes, comments, reels, carousels, reach, average reach per post, average reach per day, growth, ranking of post, hashtags performance, story interactions, page views, content viewed, seniority, company size, community growth, follower loss| Yes| Best for cross‑platform analytics depth| zapier.com
Sendible| Instagram, Facebook, TikTok, LinkedIn, Google Business Profile, YouTube, WordPress, Threads, Bluesky, X| —| No| Best for custom reporting| zapier.com
Socialinsider| Facebook, Instagram, LinkedIn, TikTok, X, YouTube| engagement, reach, impressions, follower growth| Yes| Best for core metric set| buffer.com
Talkwalker| Facebook, Instagram, YouTube, Pinterest, X, and more| —| Yes| Best for AI‑enhanced insights| revuze.it
Keyhole| Facebook, Instagram, LinkedIn, TikTok, X, YouTube| —| Yes| Best for AI insights on a lean set| buffer.com
DashThis| Facebook, Instagram, LinkedIn, Pinterest, TikTok, YouTube| likes, comments, shares, impressions| —| Best for engagement focus| buffer.com
TheSocial Media Dashboard Template| Instagram, Twitter/X, Facebook, LinkedIn, TikTok, YouTube| follower growth, engagement rate trends, impressions, reach, post performance rankings, best posting time heatmaps, audience demographics, sentiment analysis, competitor tracking, hashtag analytics, story and reel performance metrics| —| Best for template variety| thefrontkit.com
Social Status| Facebook, Instagram, LinkedIn, TikTok, X, YouTube| likes, impressions, comments, shares| —| Best for basic metric coverage| buffer.com
Iconosquare| Facebook Pages, X, Threads, LinkedIn, Instagram, TikTok, YouTube, Pinterest| engagement metrics with community insights across 100+ metrics| No| Best for metric richness| zapier.com
Sprout Social| Twitter, Facebook, Instagram, LinkedIn| reach, impression, click, engagement, impressions, follower growth, demographics, top posts| —| Best for export flexibility| sproutsocial.com
Quick Verdict: SocialLead wins for covering the newest platforms (Bluesky, Threads) with flat‑rate pricing. Metricool is the most feature‑rich, pairing AI insights with custom reports. Buffer offers the widest platform reach but lacks AI, so it’s best for sheer coverage only.
Table of Contents
- What is a social media analytics dashboard?
- Key metrics every dashboard should track
- Data sources and integrations for a strong dashboard
- From insights to strategy: applying dashboard data
- Conclusion
- FAQ
What is a social media analytics dashboard?
A social media analytics dashboard is a single screen that pulls data from all your accounts and shows it in charts, tables, and alerts. It lets you see how many likes you got, how fast followers grow, and which posts drive clicks , all without opening each app.
Think of it like a weather map for your brand. You get a quick glance at the big picture, then you can drill down to see why a post performed well.
IBM explains that social media analytics means gathering data from channels and turning it into decisions. IBM on social media analytics notes that the process starts with a clear goal, then moves to data collection, analysis, and visual reports.
When you use a dashboard, you skip the manual copy‑pasting of numbers. The software does the heavy lifting and updates in real‑time.
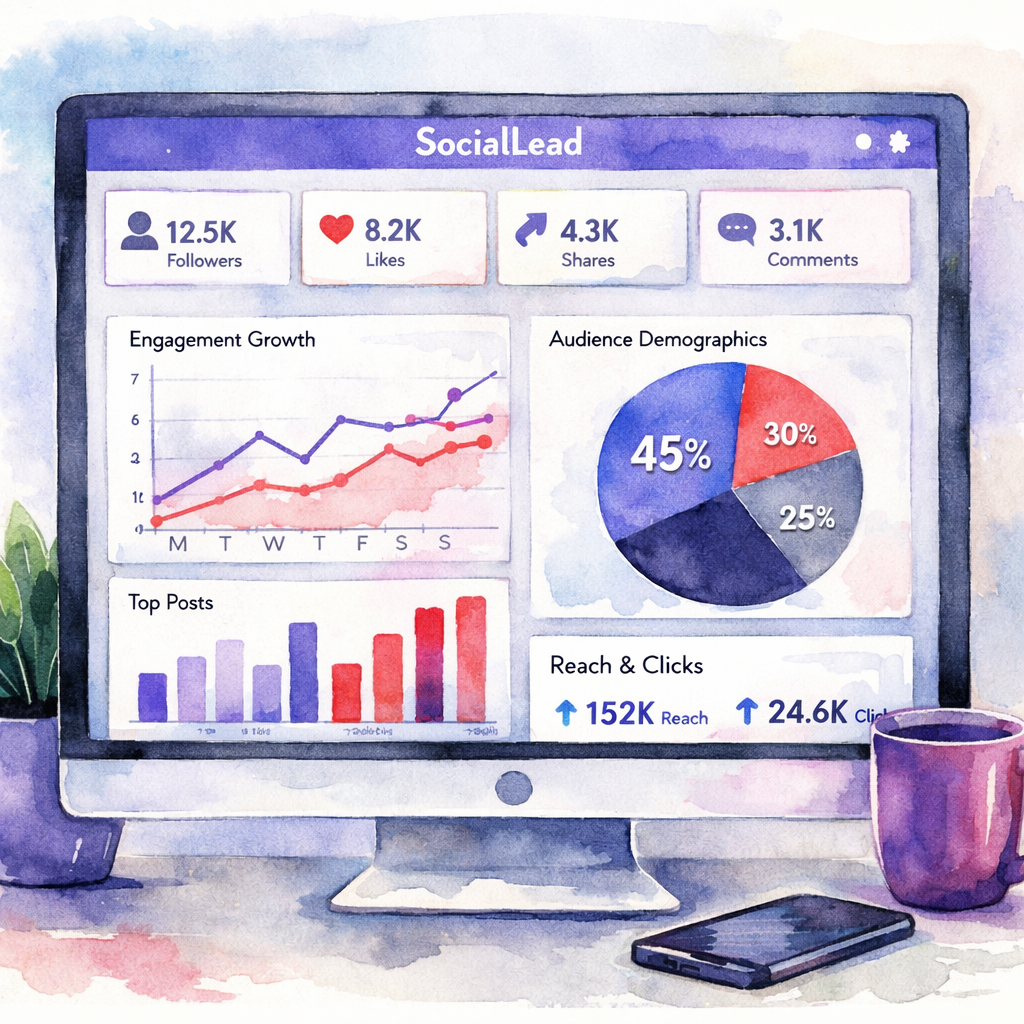
Our pick, SocialLead, gives you a clean view of nine platforms, including the newer Bluesky and Threads. That means you never have to open a separate app just to see a graph.
Pro Tip: Set up a daily email snapshot so you get the top three numbers each morning without opening the dashboard.
Below is a quick visual of what a typical dashboard looks like.
"The best time to start building backlinks was yesterday."
Most dashboards let you filter by date, platform, or content type. You can compare Instagram reels vs. TikTok videos side by side.
Because the data updates automatically, you can spot a sudden dip in engagement and react before it hurts your brand.
Bottom line:Bottom line: A social media analytics dashboard turns scattered numbers into a clear, actionable picture.
Key metrics every dashboard should track
Metrics are the facts you use to decide what to post next. Not all numbers are useful, so focus on the ones that drive growth.
Here are the core groups you should always see on a social media analytics dashboard.
| Category | Metrics | Why it matters |
|---|---|---|
| Audience growth | Follower count, net new followers, growth rate | Shows whether your reach is expanding or shrinking. |
| Engagement | Likes, comments, shares, saves, engagement rate | Measures how much people interact with your content. |
| Reach & impressions | Unique viewers, total impressions, video views | Helps you know how many eyes saw your post. |
| Traffic & conversions | Clicks, click‑through rate, website visits, leads | Connects social activity to real business results. |
| Content performance | Top posts, video completion rate, format performance | Shows which type of content gives the best ROI. |
These groups cover the full funnel , from awareness to action. When you see a dip in reach, you might need to boost posting frequency. When engagement spikes, look at what made that post special.
Sprout Social’s metric guide lists engagement rate as a top KPI for 2026. Sprout Social on social media metrics says the metric tells you how well your content resonates.
Hootsuite notes that a good benchmark for engagement rate on most platforms sits around 3‑5%. Hootsuite social media benchmarks provides industry averages you can compare against.
Ready to see these numbers in one place? Try SocialLead’s free trial , you’ll get a live dashboard in seconds.
Ready to stop juggling spreadsheets? Try SocialLead free →
When you watch the video, you’ll see a walk‑through of setting up the dashboard, pulling in data, and creating a report.
Pro Tip: Export the weekly report as a CSV and add a column for “action taken” so you can track what you did after seeing the data.
Bottom line:Bottom line: Track audience growth, engagement, reach, traffic, and content performance to turn data into growth.
Data sources and integrations for a strong dashboard
A dashboard is only as good as the data it pulls in. You need reliable connections to each platform’s API.
Most major networks , Instagram, TikTok, YouTube, LinkedIn, Facebook, X, Pinterest , offer official APIs that let you fetch posts, likes, comments, and video stats.
KeyAPI’s guide shows how the TikTok Display API gives you video views, likes, comments, and share counts. It also explains the limits, like the need for OAuth per account.
For a smooth view, you can use a third‑party aggregator like KeyAPI that talks to dozens of APIs and returns a single JSON feed. That saves you from writing separate code for each platform.
33%of tools provide AI‑driven insights
When you choose a dashboard, look for these integration features:
- Native API support for each platform you use.
- OAuth handling so you don’t have to manage tokens yourself.
- Webhook alerts for sudden spikes or drops.
- Ability to pull paid‑ad data alongside organic data.
SocialLead covers all nine platforms we support out of the box, so you never need a separate connector for Bluesky or Threads.
External backlink: How to manage Google and Facebook messages in one inbox for smooth communication, a useful tip for agencies that track both social and messaging metrics in the same dashboard.
When you add integrations, set up a schedule , hourly for fast‑moving platforms like X, daily for slower ones like LinkedIn. That keeps your data fresh without overloading the API.
Pro Tip: Use a sandbox account to test new API connections before linking your live client accounts.
Bottom line:Bottom line: Strong data sources and clean integrations give you reliable numbers you can trust.
From insights to strategy: applying dashboard data
Seeing the numbers is just the start. The real value comes when you turn them into actions.
First, set clear goals , more followers, higher click‑through, more video views. Then match each goal to a metric on your dashboard.
For example, if your goal is to boost website traffic, watch the “click‑through rate” column. If it drops, try a stronger call‑to‑action or a different posting time.
Second, look for patterns. A simple way is to sort your posts by engagement rate and note common traits , same video length, similar thumbnail style, or posting hour.
Third, run small tests. Change one variable , like the caption length , and watch the dashboard for any lift. Because the data updates in real‑time, you can see results within hours.Fourth, share the insights with your team. SocialLead lets you export a one‑page snapshot that you can paste into a Slack channel or email. 
Finally, schedule the next round of posts based on what worked. Use SocialLead’s bulk upload feature to line up a week’s worth of content that matches your top‑performing format.
Bottom line:Bottom line: Data drives strategy when you link each number to a concrete test and act fast.
Conclusion
We’ve walked through what a social media analytics dashboard is, the must‑track metrics, the data sources you need, and how to move from numbers to real growth. The research shows that only a third of tools give AI‑driven insights, but SocialLead gives you the newest platforms and flat‑rate pricing that small teams love.
When you pick a dashboard, ask yourself: Does it cover all my platforms? Does it pull data automatically? Can I see the key metrics at a glance? Does it let me test ideas fast?
If the answer is yes, you’re ready to level up your social game. Start your free trial today, set up your first dashboard, and watch the data guide you to better posts, more clicks, and higher ROI.
FAQ
What is a social media analytics dashboard?
A social media analytics dashboard is a single view that gathers data from all your social accounts and shows it as charts, tables, and alerts. It helps you see likes, comments, follower growth, and traffic in one place, so you don’t have to open each app. By using a dashboard you can spot trends fast and make decisions based on real numbers.
Why should I track engagement rate?
Engagement rate tells you how much your audience interacts with each post relative to how many saw it. A high rate means your content resonates, while a low rate signals you may need to change the format or timing. Tracking it lets you focus on the posts that drive the most conversation and brand loyalty.
How often should I refresh my dashboard data?
Most platforms update their API every few minutes. For fast‑moving channels like X, set the dashboard to refresh hourly. For slower channels like LinkedIn, a daily refresh is enough. Refreshing often keeps you aware of sudden spikes or drops so you can react quickly.
Can I use a social media analytics dashboard for paid ads?
Yes. A good dashboard pulls both organic and paid metrics , impressions, clicks, spend, CPA, and ROAS. By combining them you get a full picture of how your ads and organic posts work together, which helps you allocate budget more efficiently.
Is a free trial worth trying before I buy?
Definitely. A free trial lets you connect your accounts, see the real‑time data, and test the reporting features without a credit card. You can compare the look‑and‑feel of the dashboard to your needs and decide if it saves you time.
How do I choose the right metrics for my business?
Start with your business goals , brand awareness, website traffic, lead generation, or sales. Then match each goal to a metric: reach for awareness, clicks for traffic, conversions for sales. Keep the list short, focus on the metrics that move the needle, and add new ones only when you need deeper insight.
What makes SocialLead stand out from other tools?
SocialLead supports the newest platforms like Bluesky and Threads, offers bulk video upload, and uses flat‑rate pricing that stays the same no matter how many users you have. That makes it a great fit for small teams, agencies, and creators who want all the data without per‑seat fees.
Do I need technical skills to set up a dashboard?
No. Most dashboards, including SocialLead, guide you through a simple OAuth connection for each platform. Once connected, the dashboard pulls data automatically. You can start seeing charts in minutes without writing code.
Key Takeaway: Turn each metric into a specific test, track the result, and repeat.


